In active development · TypeScript, React, Three.js
The Economic Report Influence Graph
Every important number in public life — inflation, a disability payment, how much your city gets for road repair — is calculated from some other number, which was calculated from another, back to a handful of foundational statistical releases. Almost nobody can see that structure, including the people who depend on it.
This draws it. Each sphere is a real published report, each line a documented dependency between two of them, and a report’s size is how much everything else rests on it. It runs in a browser, in 3D, with no backend.
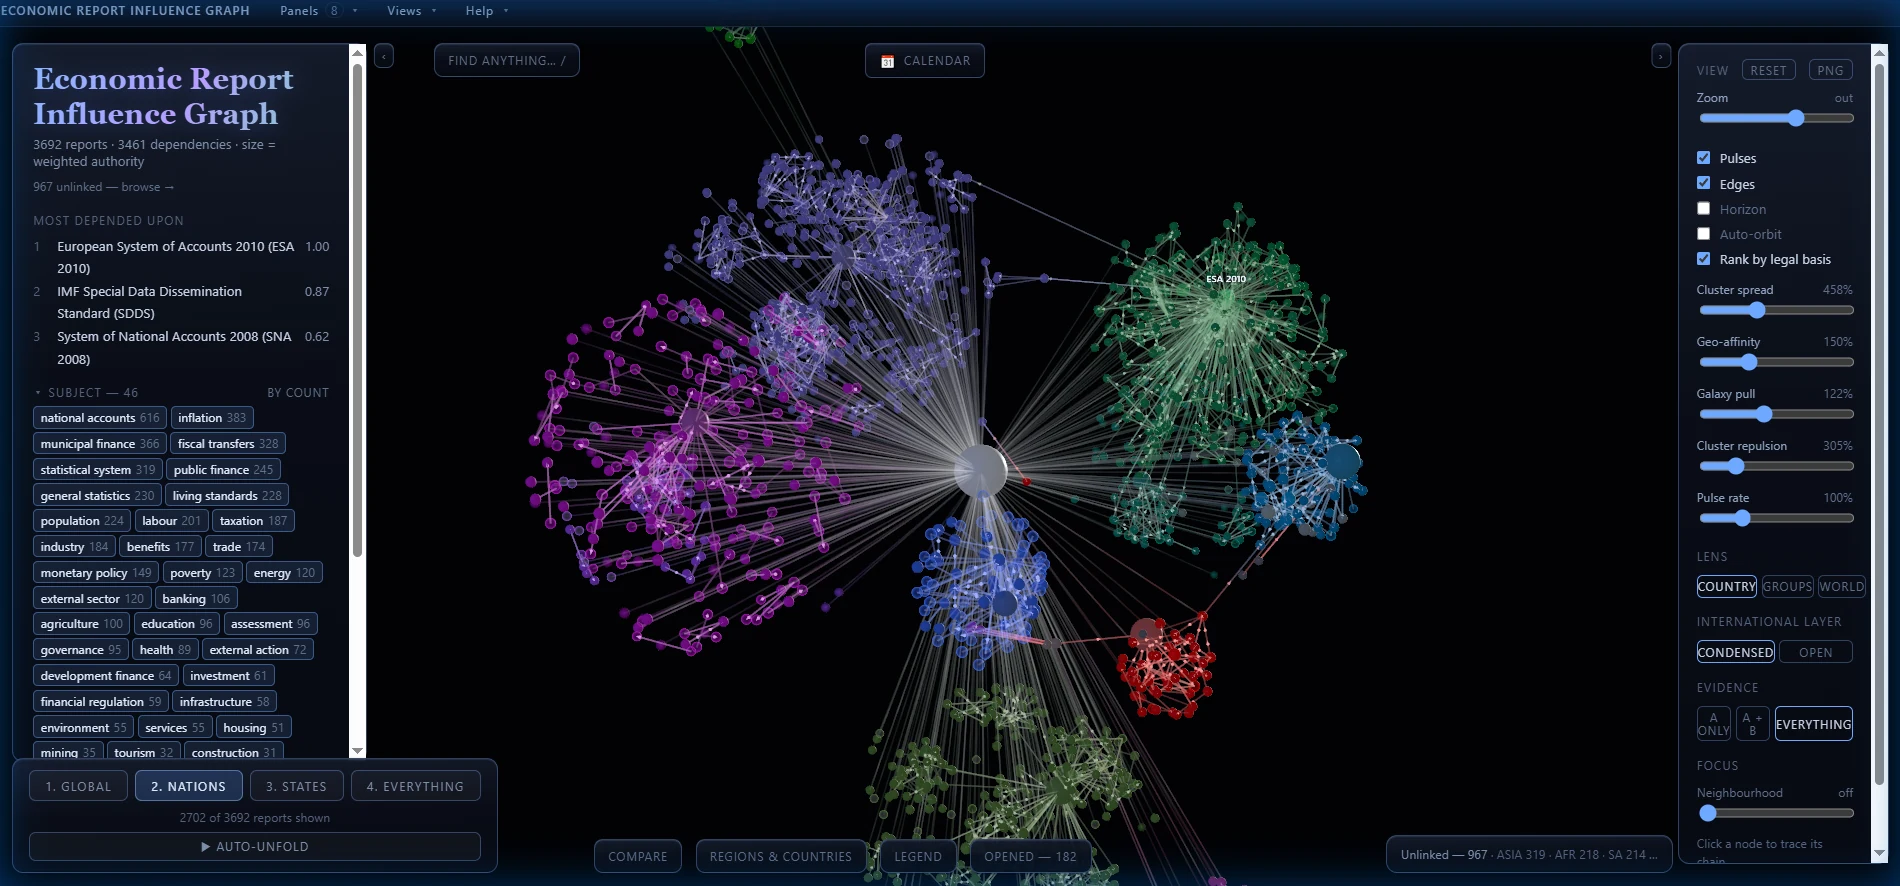
The rule it runs on, a live slice of one city’s budget, and three things the AI got wrong while building it: read the case study.